Whole document tree
14.3. Correlation Tool
The correlation tool calculates the pairwise Pearson correlation coefficients of the given variables. Use this tool to calculate any number of correlation coefficients at the same time. The variables for which the correlations are calculated are specified by the "Input Range:" entry. The input range can consist of either a single range or a comma separated list of ranges. The given range or ranges can be grouped by columns, by rows, or by areas.
If the first row or column of the given ranges, or the first field of each area contains labels, the "Labels" option should be selected.
Example 14-3. Using the Correlation Tool
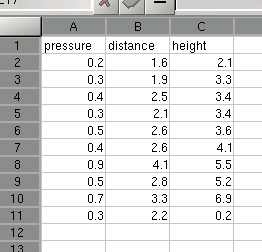
For example, you want to calculate the correlation between three variables, one each in columns A, B, and C. Both variables have 10 values in rows 2 to 11 with labels in row 1 (see Figure 14-11).
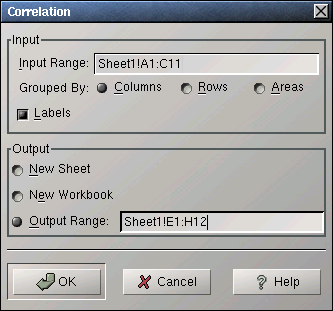
Enter A1:B11 in the "Input Range:" entry by typing this directly into the entry or clicking in the entry field and then selecting that range on the sheet. In the latter case the entry will also contain the sheet name.
Select the "Columns" radio button next to "Grouped By:", since each variable is in its own column.
Select the "Labels" option since the first row contains labels. (see Figure 14-12).
Specify the output options as described above.
Press the OK button.
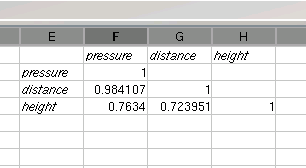
The calculated correlations are given in a table with each column and row labeled with the names of the variables. If the names are not given in the input range, Gnumeric generates them. In our example, the correlation between the variables in column A and B, can be found in the second column and third row of the results table (see Figure 14-13).