Whole document tree
14.8. F-Test: Two-Sample for Variances Tool
Use the F-Test tool to test whether two population variances are different against the null hypothesis that they are not.
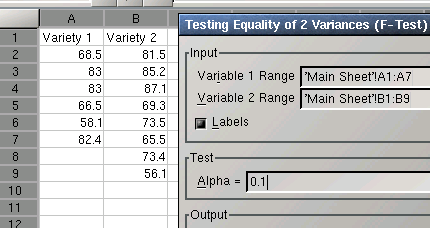
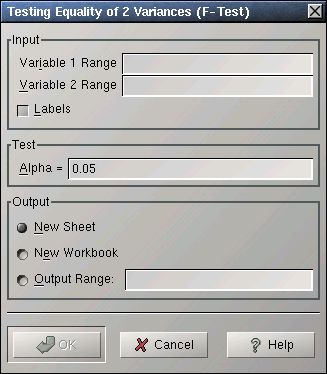
Specify the variables in the "Variable 1 Range:" and "Variable 2 Range:" entries. The "Alpha:" entry contains the significance level which is by default 5%.
If the first field of each range contains labels, select the "Labels" option. The names of the variables will be included in the output table.
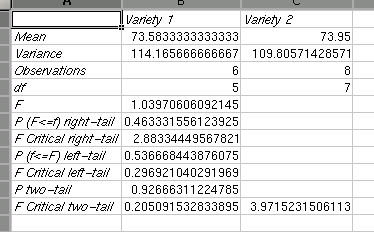
The results are given in a table. This table contains the mean, variance, count of observations and the degree of freedom for both variables. The output table also includes the F-value, the one-tailed probability for the F-value, and the F Critical value for one-tailed test and the corresponding values for a two tailed test. The one-tailed probability for the F-value ("P(F<=f) one-tail" row) is the probability of making a Type I error in the one-tailed test. Similarly, the two-tailed probability for the F-value ("P two-tail" row) is the probability of making a Type I error in the two-tailed test. Since in the two-tailed F-Test both critical values are positive, the "F Critical two-tail" row contains two numbers.
If the output is directed into a specific output range, that range should contain at least three columns and eight rows.