Whole document tree
14.9. Histogram Tool
14.9.1. Introduction
The histogram calculates several kinds of histograms for one or more variables. The types of histogram created are determined by the options selected.
As shown in Figure 14-31, the histogram dialog has four tabs. We will introduce them in sequence.
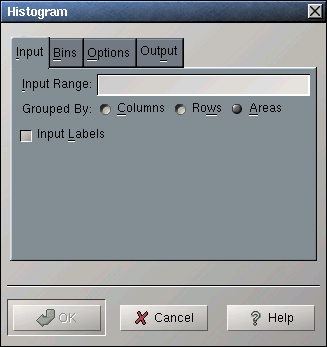
14.9.2. The "Input" Tab
The "Input" tab contains the field specifying the data to be used for the histogram.
The "Input Range" entry contains a single range or a list of ranges, that can be grouped into variables by rows, columns, or areas. The "Bin Range" entry contains a single range of cutoff values. Both ranges may also include labels.
If the first row or column of the given input ranges, or the first field of each area contains labels, the "Input Labels" option should be selected.
14.9.3. The "Bins" Tab
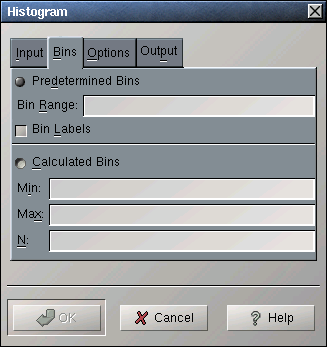
The bins (or classes) for the histogram can either be predetermined by data contained in your workbook or calculated by the histogram tool.
Select the "Predetermined Bins" option to specify data on your worksheet in the "Bin Range:" entry. The range should consist of a sigle column or two columns (the first one containing labels). If the first column of the bin range contains labels, select the "Bin Labels" option. The values in the last column are used as seprators between adjacent bins.
Select the "Calculated Bins" option to have the bins determined by the tool. Enter the desired number of bins in the "N:" entry. It is recommended (but optional) that you specify the minimum and maximum cutoffs in the "Min:" and "Max:" entries.
14.9.4. The "Options" Tab
The options in the options tab modify the appearance of the histogram:
The "Pareto" option causes the bins to be sorted by decreasing frequency of the first variable.
The "Percentages" option adds a histogram in terms of percentages rather than frequencies.
The "Cumulative Percentages" option adds a cumulative histogram.
The "Chart" option is not implemented.
14.9.5. The "Output" Tab
The Output tab contains the standard output options and fields described in Section 14.1.
14.9.6. A Histogram Example
Example 14-9. Using the Histogram Tool
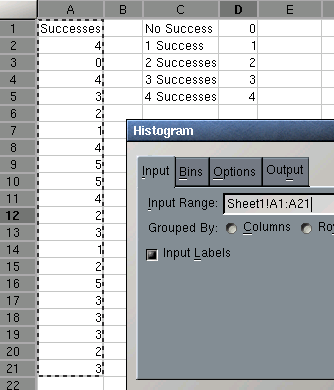
For example, you want to calculate a histogram and a cumulative histogram in percentages for a the number of successes in several sequences of trials. The numbers of successes are recorded in column A and the classes of interest in column D with labels in column C (see Figure 14-33).
Enter A1:A21 in the "Input Range:" entry of the "Input" tab by typing this directly into the entry or clicking in the entry field and then selecting that range on the sheet. In the latter case the entry will also contain the sheet name.
Since you only have one variable select the "Areas" or "Columns" radio button next to "Grouped By:".
Select the "Input Labels" option since the first cell of the Input Range contains a label.
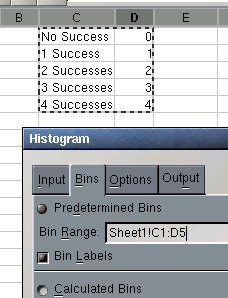
Enter C1:D5 in the "Bin Range:" entry of the "Bins" tab. The "Predetermined Bins" option will now also be selected (see Figure 14-34).
Select the "Bin Labels" option since the first column of the Bin Range contains labels.
Select the "Percentage" and "Cumulative Percentages" options of the "Options" tab.
In the "Output" tab, specify the output options as described in Section 14.1.
Press the OK button.
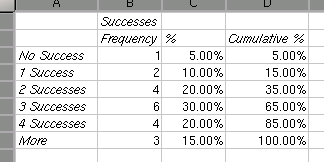
The results are shown in Figure 14-35.