Whole document tree
14.11. Rank and Percentile Tool
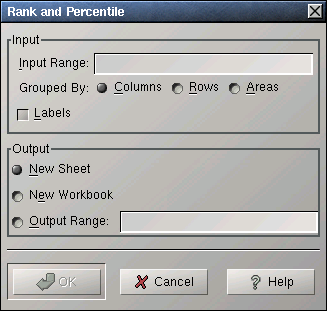
Use this tool to rank given data and to calculate the percentiles of each data point.
Specify the datasets to use in the "Input Range:" entry. The given range can be grouped into datasets by columns, by rows, or by areas.
For each dataset, the tool creates three columns in the output table:
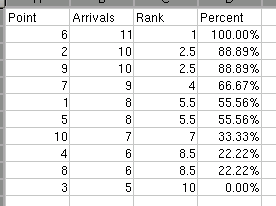
The first column gives the indices of the ordered data from largest to smallest data value.
The second column gives data values corresponding to the indices in the first column.
The third column indicates the percentile of the data value in the second column.
If you have labels in the first cell of each data set, select the "Labels" option.
Example 14-11. Using the Rank and Percentile Tool
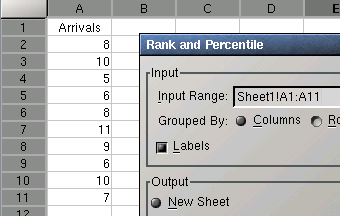
Figure 14-40 shows some example data and Figure 14-41 the corresponding output.
 | In the case of ties, the rank calculated by this tool differs from the value of the RANK function for the same data. This tool calculates the rank as it is normally used in Statistics: If two values are tied, the assigned rank is the average rank for those entries. For example in Figure 14-40 the two values 10 are the second and third largest values. Since they are equal each receives the rank of 2.5, the average of 2 and 3. The rank function on the other hand assigns the rank as it is normally used to determine placements. The two values 10 would therefore each receive a rank of 2. |


