Whole document tree
14.12. Regression Tool
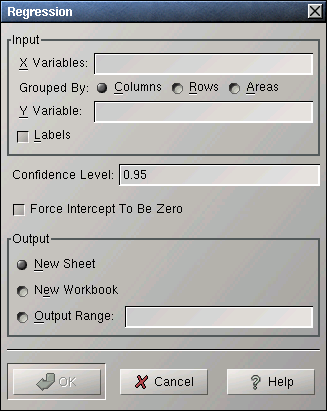
The regression tool performs a multiple regression analysis.
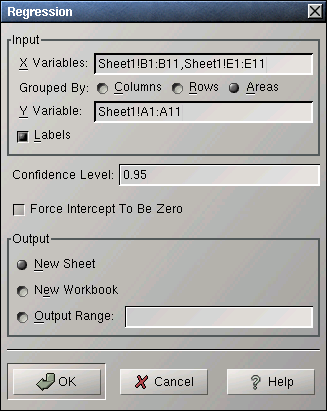
Enter a range or list of ranges containing the independent variables into the "X Variables:" entry. These ranges can be grouped into the various independent variables by columns, by rows, or by areas. Select the appropriate option.
Enter a single range containing the dependent variable into the "Y Variable:" entry.
If the ranges for the independent and dependent variables also contains labels in the first field of each row, column or area, select the " Labels" option.
Specify the confidence level in the "Confidence Level:" entry. The default is 95%.
To force the regression line or plane to pass through the origin, select the "Force Intercept To Be Zero" option.
Specify the output options as described above. If the output is directed into a specific output range, that range should contain at least seven columns and 17 rows more than there are independent variables.
Example 14-12. Using the Regression Tool
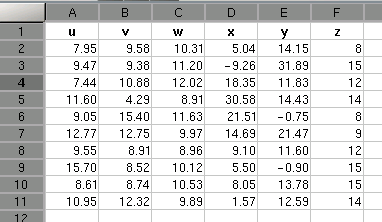
Suppose you want to perform a regression analysis on the data given in Figure 14-43 using v and y as independent variables and u as dependent variable.
Enter B1:B9,E1:E9 in the "X Variables:" entry by typing this directly into the entry or clicking in the entry field and then selecting the first part range on the sheet, typing comma, and then selecting the second range. In the latter case the entry will also contain the sheet name.
Enter A1:A9 in the "Y Variable:" entry.
Select the "Columns" or "Areas" option since each variable is in its own column and also its own area.
Select the "Labels" option since the first row contains labels. (see Figure 14-44).
Specify the output options as described above.
Press the OK button.
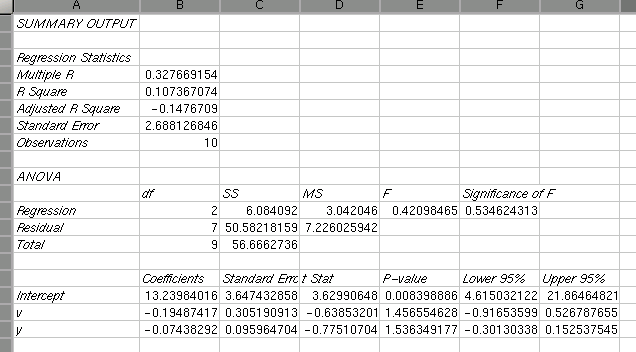
The output of this regression analysis is shown in Figure 14-45.