Whole document tree
|
|
|
|
Index Main window: Color correction:
Standard options window Advanced options window Preview:
Batch scan:
Setup: |
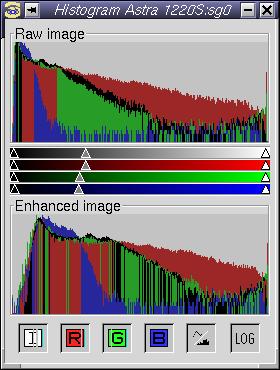 The histogram shows the color density of the area that is selected in the preview window. The top histogram represents the scanned raw image, the bottom histogram represents the enhanced image. In grayscale mode, there are three sliders in the gray range. The black slider defines the black point, the white silder the white point and the gray slider the gray point (gamma). If the rgb default button (in the xsane main window) is not selected in color mode there are also sliders in the red, the green and the blue range. In this case a move of a slider of the gray range also moves the sliders of the color ranges. |
Author: Oliver Rauch